
A core feature of any good API Management solution is the recording of and reporting on interesting metrics related to API requests. Because apiman acts as a central Gateway for all managed API traffic, it is the perfect location to record information about each and every request. This allows it to report on interesting data it has recorded, related to response times, successful vs. failed requests, total number of requests broken down by time, consumer id, or plan used. As you can imagine, this is extremely valuable information, and it is a bit embarrassing that we haven’t offered this functionality until now!
But that gap is finally filled with version 1.1.4.Final.
Overview
First let me give you just a high level overview of what this is all about. Every time the API Gateway gets a request from an API client, it will add a record in the metrics system with a bunch of interesting fields. These include but are not limited to:
-
Request start and end times
-
API start and end times (i.e. just the part of the request taken up by the back end service)
-
Resource path
-
Response type (success, failure, error)
-
API info (org id, id, version)
-
Client app info (org id, id, version)
All of this information is recorded in the metrics storage system so that later on it can be analyzed/mined for interesting trends.
In the API Manager, we extract interesting reports from the recorded metrics data and display it as graphs in the UI (as well as provide the data via a set of metrics related REST endpoints in the API Manager’s own API).
How do we store metrics?
Out of the box, apiman stores the metrics information into an elasticsearch index. This elasticsearch instance is provided as part of the apiman distribution and is enabled and running by default. If you wish to use a different elasticsearch instance that’s of course no problem - all it requires is some tweaking of settings in the apiman.properties file. I recommend having a look at the Installation Guide for more details.
The intention is to support various metrics storage systems, not just elasticsearch. For example, we have InfluxDB and Hawkular implementations in progres. You can even implement your own! Custom metrics systems is likely a separate blog post, but note that storing metrics data into an alternate system is easy - simply implement the IMetrics interface:
{% highlight java %} package io.apiman.gateway.engine;
public interface IMetrics {
/**
-
Records the metrics for a single request. Most implementations will likely
-
asynchronously process this information. */ public void record(RequestMetric metric);
/**
-
Provides the component registry (before any call to {@link #record(RequestMetric)})
-
is made. Metrics can then access HTTP client components, etc. */ public void setComponentRegistry(IComponentRegistry registry); } {% endhighlight %}
A little bit of configuration foo in the apiman.properties is all it takes to switch from elasticsearch to your custom provider.
Metrics data from the API Manager’s REST API
There is no way to extract arbitrary metrics information from the metrics source unless you hit the metrics storage directly. For example, you could use Kibana to directly view the apiman metrics information stored in elasticsearch. In the future we will be exploring ways to integrate the data visualization tools that come with each of the providers we support (elasticsearch, hawkular, influxcb, etc). However, we do provide a set of REST endpoints you can use to extract common metrics. These REST endpoints are available as a part of the standard API Manager’s REST API.
Please refer to the API documentation for the latest information, but at the time of this blog post the available metrics endpoints are:
-
/organizations/<ORG_ID>/apis/<API_ID>/versions/<VERSION>/metrics/usage</VERSION></API_ID></ORG_ID> -
/organizations/<ORG_ID>/apis/<API_ID>/versions/<VERSION>/metrics/appUsage</VERSION></API_ID></ORG_ID> -
/organizations/<ORG_ID>/apis/<API_ID>/versions/<VERSION>/metrics/planUsage</VERSION></API_ID></ORG_ID> -
/organizations/<ORG_ID>/apis/<API_ID>/versions/<VERSION>/metrics/responseStats</VERSION></API_ID></ORG_ID> -
/organizations/<ORG_ID>/apis/<API_ID>/versions/<VERSION>/metrics/summaryResponseStats</VERSION></API_ID></ORG_ID> -
/organizations/<ORG_ID>/apis/<API_ID>/versions/<VERSION>/metrics/planResponseStats</VERSION></API_ID></ORG_ID> -
/organizations/<ORG_ID>/apis/<API_ID>/versions/<VERSION>/metrics/appResponseStats</VERSION></API_ID></ORG_ID>
The 'usage' endpoints return information about the number of requests made. The 'responseStats' endpoints are similar, but are broken down by response type (successful vs. failed vs. error responses). All endpoints require a time range (from and to). The /usage and /responseStats endpoints also require a time interval, because they both return a histogram/time series dataset.
Sensible limits are enforced on all these endpoints to discourage abuse. For example, don’t ask for a per-minute granularity time series dataset over a ten year data range. The system won’t like that one bit.
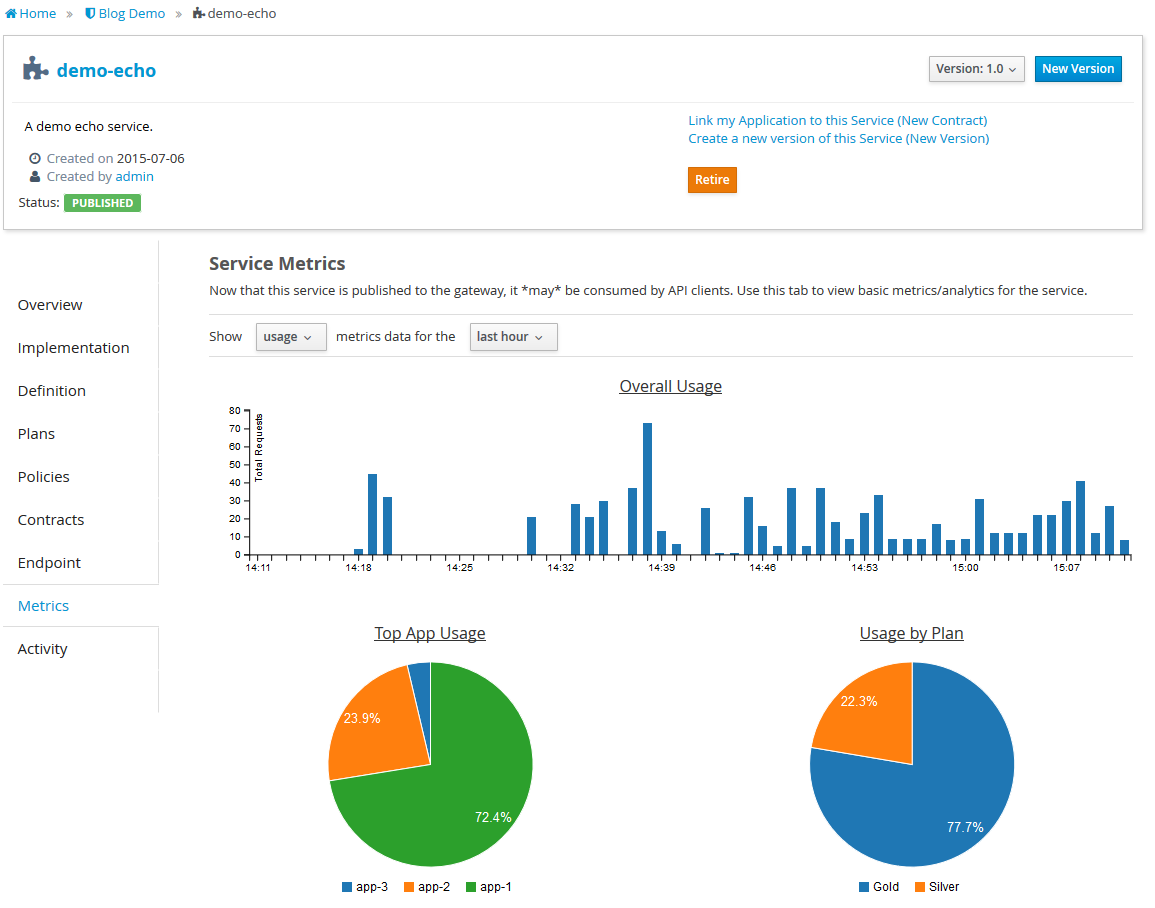
Viewing metrics info in the UI
The metrics information provided by the API is also available directly in the API Manager UI. For any published API, simply navigate to the Metrics tab for that API (in the provider section of the UI). The UI should be pretty easy to use - simply pick a type of metric you want to see and a pre-configured time period! Here is what the usage metrics might look like for a typical API:
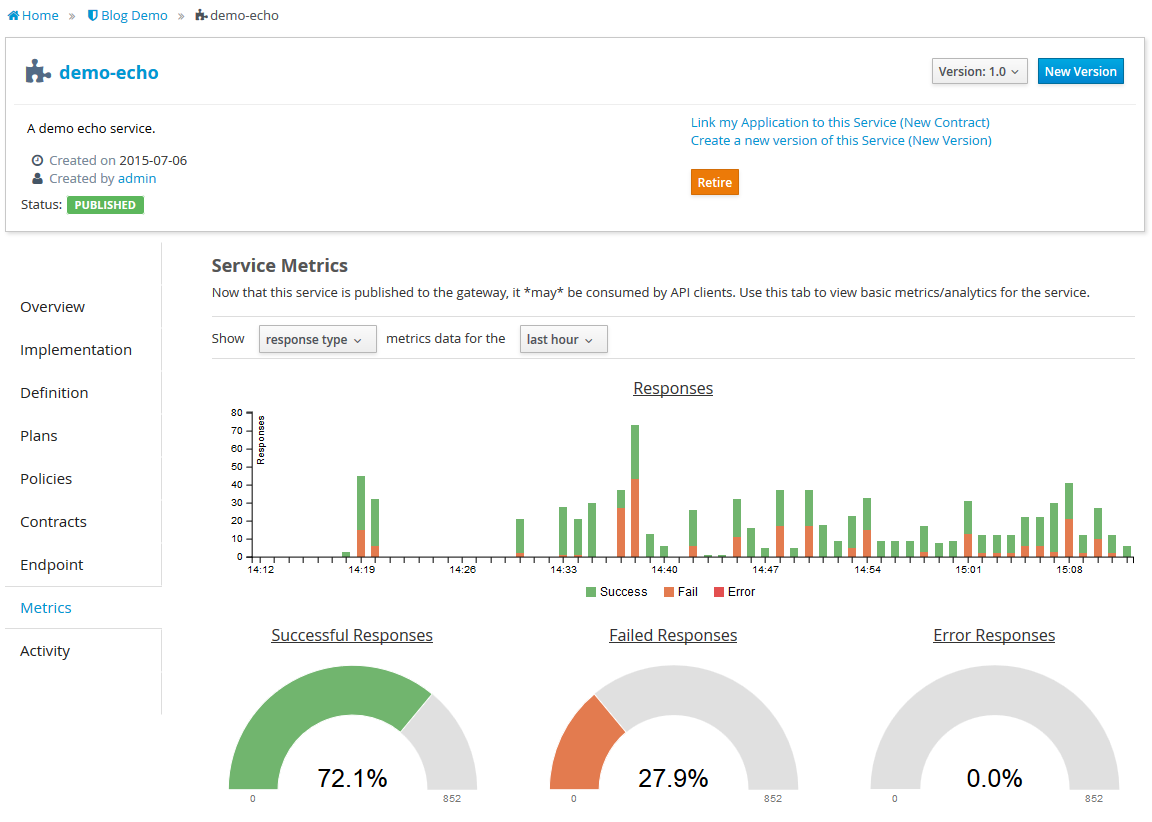
And here is what you might expect to find for typical response type metrics:
Conclusion
As you can see, this is highly valuable information to have. We only have a couple of different tags of metrics exposed via the API and UI right now - so this is your opportunity to come tell us what you’d like to see! Join the apiman metrics conversation on our mailing list or IRC channel.
/post